Short Answer
The following figure gives the graphs of and .
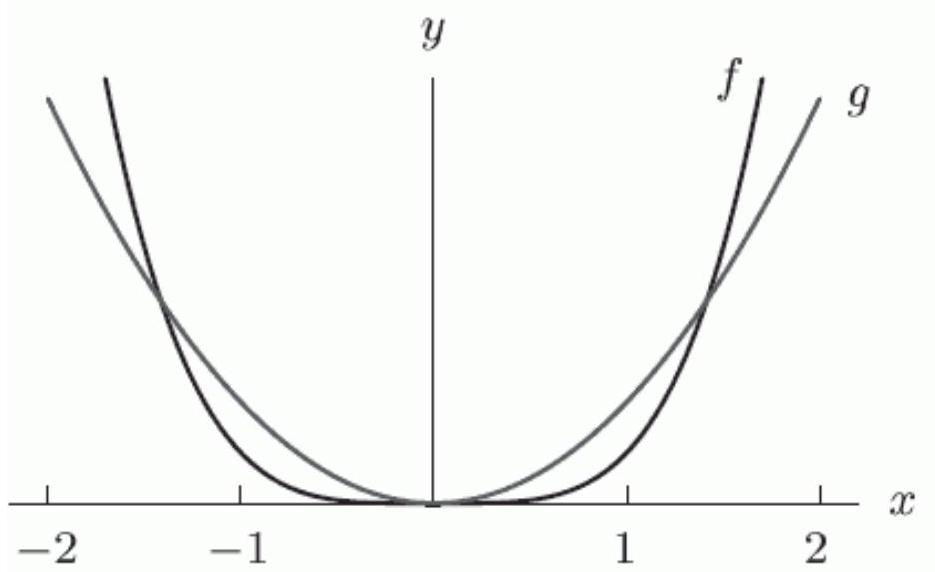
If , what is
Correct Answer:

Verified
Correct Answer:
Verified
Related Questions
Q128: Write the equation for the following
Q129: George measures the force exerted by a
Q130: Poiseuille's law says that the rate
Q131: Is <span class="ql-formula" data-value="y=\frac{2}{x^{2}-9}+0.25"><span class="katex"><span
Q132: The following table contains the names
Q134: The number of yearly childbirths for a
Q135: Which of the following formulas has
Q136: What is the domain of the
Q137: The squirrel population in a certain area
Q138: As <span class="ql-formula" data-value="x \rightarrow