Multiple Choice
Let . Which of the following figures shows the graph of ?
A) 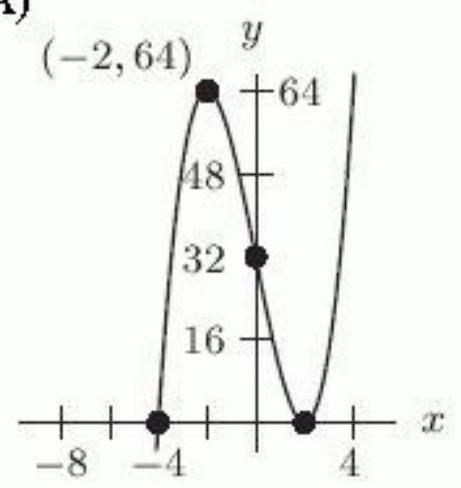
B) 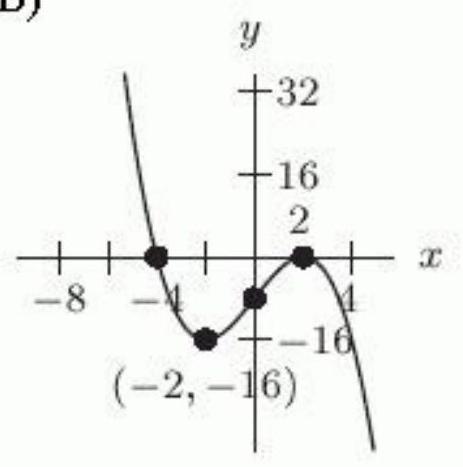
C) 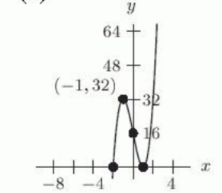
D) 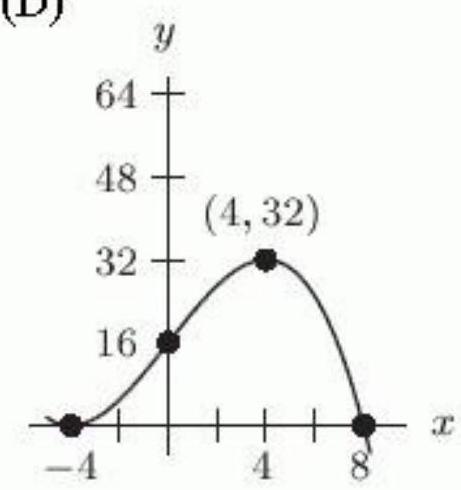
Correct Answer:

Verified
Correct Answer:
Verified
Related Questions
Q135: Which of the following formulas has
Q136: What is the domain of the
Q137: The squirrel population in a certain area
Q138: As <span class="ql-formula" data-value="x \rightarrow
Q139: What is the degree of the
Q140: The sum of two even functions is
Q141: One of the following tables of
Q143: The following table represents the amount
Q144: Which of the following are true?<br>A)
Q145: As <span class="ql-formula" data-value="x \rightarrow-\infty,