Solved
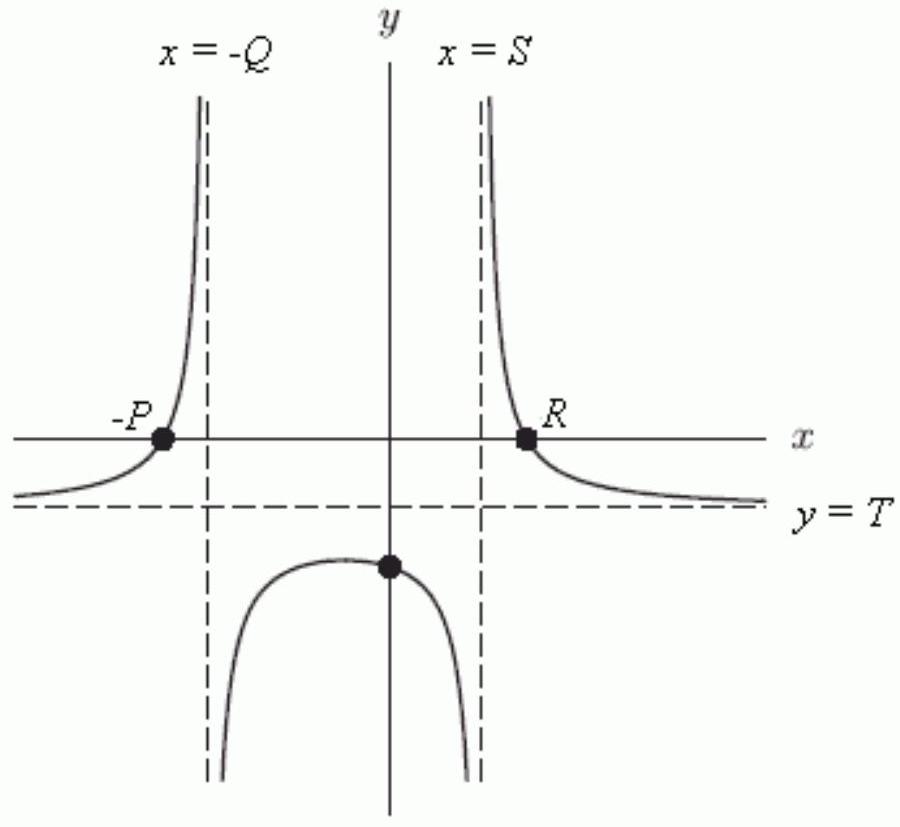
The Following Figure Is a Graph Of , Where And All of the Constants Appearing in the Function Are
Short Answer
The following figure is a graph of , where and all of the constants appearing in the function are positive. What is the value of (in terms of , etc.)?
Correct Answer:

Verified
Correct Answer:
Verified
Related Questions
Q115: The number of yearly childbirths for a
Q116: Find a power function through the
Q117: Farmer Brown has 112 feet of
Q118: Suppose that <span class="ql-formula" data-value="f(x)"><span
Q119: A <span class="ql-formula" data-value="10 \mathrm{~kg}"><span
Q121: A right circular cylinder has a volume
Q122: Find the equation of the vertical
Q123: What is the long-run behavior of
Q124: Let <span class="ql-formula" data-value="f(x)=(x-2)^{2}(x+4)"><span class="katex"><span
Q125: Is the function <span class="ql-formula"