Essay
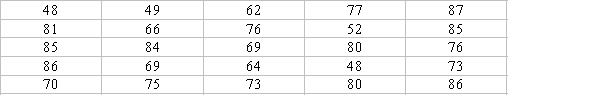
Below are skills test scores for applicants of a software engineering job. Put the data into a frequency distribution using intervals of size 8. Include columns for percentages and cumulative percentages.
Correct Answer:

Verified
Correct Answer:
Verified
Related Questions
Q10: In June 2014, the entire province of
Q11: Why do researchers commonly use intervals when
Q12: Which of the following is a requirement
Q13: Which of these distributions appropriately illustrates real
Q14: Why do frequency distributions of interval-ratio-level data
Q16: How is a proportion calculated?<br>A) The number
Q17: What would be the appropriate graph to
Q18: How does a frequency polygon differ from
Q19: An environmental scientist reports that the proportion
Q20: The intervals below represent ages of respondents.