Essay
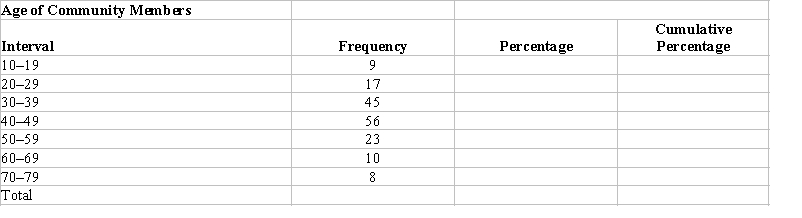
The frequency distribution below displays the distribution of age for a sample drawn from a community. Finish the table by completing the columns for percentages and cumulative percentages.
Correct Answer:

Verified
Correct Answer:
Verified
Related Questions
Q16: How is a proportion calculated?<br>A) The number
Q17: What would be the appropriate graph to
Q18: How does a frequency polygon differ from
Q19: An environmental scientist reports that the proportion
Q20: The intervals below represent ages of respondents.
Q22: What type of data is most appropriate
Q23: Table 2.2 Number of Prior Convictions among
Q24: What type of data is used with
Q25: What percentage value corresponds to a ratio
Q26: Which of the following explains how to