Multiple Choice
Use the given table or graph to write the inequality described.
-The sales figures for the Big "D" Company area shown below in a line plot. 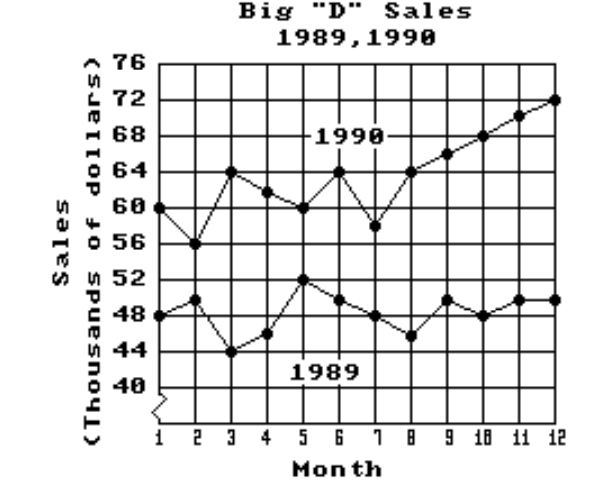
Use an inequality to compare the sales for July 1989 and July 1990.
A)
B)
C)
D)
Correct Answer:

Verified
Correct Answer:
Verified
Q83: Determine whether the first number is
Q84: Solve the problem.<br>-The dimensions of a rectangular
Q85: The projected population in 2030 for a
Q86: Round as indicated.<br>-3445 to the nearest ten<br>A)
Q87: Simplify.<br>- <span class="ql-formula" data-value="81 \div 3+\{5
Q89: Write a word name for the number
Q90: Determine whether the first number is
Q91: Add.<br>-<img src="https://d2lvgg3v3hfg70.cloudfront.net/TB9836/.jpg" alt="Add. - A) 108
Q92: Find the perimeter of the figure.<br>-A
Q93: Simplify.<br>- <span class="ql-formula" data-value="10^{2}+4^{2} \div 2^{2}"><span