Multiple Choice
Use the given table or graph to write the inequality described.
-The sales figures for the Big "D" Company area shown below in a line plot. 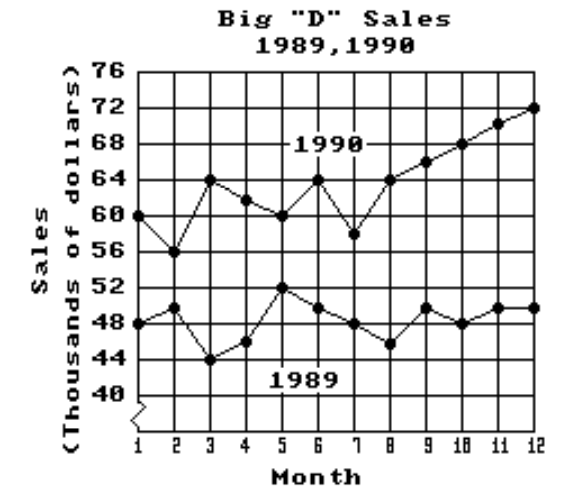
Use an inequality to compare the sales for January 1990 and December 1990.
A)
B)
C)
D)
Correct Answer:

Verified
Correct Answer:
Verified
Q290: Simplify.<br>- <span class="ql-formula" data-value="[20-(4+6) \div 2]-[1+12
Q291: Write the word or phrase that
Q292: Round to the nearest thousand.<br>-11,254<br>A) 12,000<br>B) 11,000<br>C)
Q293: Answer the question.<br>-What does the digit 2
Q294: Multiply by 1, 2, 3, and
Q296: Write the word or phrase that best
Q297: Answer the question.<br>-What does the digit 7
Q298: Simplify.<br>- <span class="ql-formula" data-value="2^{15} \div 2^{8}
Q299: Multiply.<br>-<img src="https://d2lvgg3v3hfg70.cloudfront.net/TB9836/.jpg" alt="Multiply. - A) 90
Q300: Use < or > for