Multiple Choice
Use the given table or graph to write the inequality described.
-The bar graph below shows the number of students by major in the College of Arts and Sciences.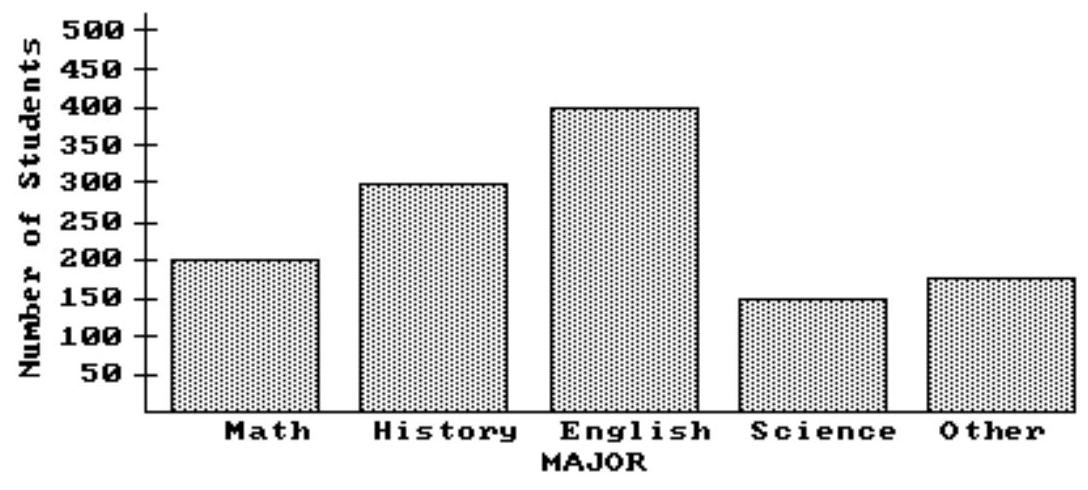
Use an inequality to compare the number of math and english majors.
A)
B)
C)
D)
Correct Answer:

Verified
Correct Answer:
Verified
Q17: Find the LCM of the set of
Q18: Simplify.<br>- <span class="ql-formula" data-value="5 \cdot 5
Q19: Multiply by 1, 2, 3, and
Q20: Simplify.<br>- <span class="ql-formula" data-value="13+29 \cdot 25"><span
Q21: Multiply by 1, 2, 3, and
Q23: Find the LCM of the set of
Q24: Divide, if possible. If not possible,
Q25: Solve the problem.<br>-The earth, Jupiter, Saturn, and
Q26: Divide.<br>-<img src="https://d2lvgg3v3hfg70.cloudfront.net/TB9836/.jpg" alt=" Divide. -
Q27: Write exponential notation.<br>- <span class="ql-formula" data-value="4