Multiple Choice
Use the pictograph to answer the question.
-For selected countries, this pictograph shows approximately how many kilograms of seafood are consumed by each person (per capita) annually.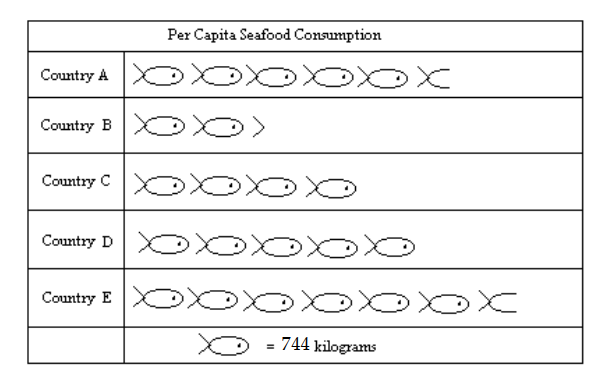
People in Country D eat approximately what percent more seafood than people in Country C?
A)
B)
C)
D)
Correct Answer:

Verified
Correct Answer:
Verified
Related Questions
Q39: For the set of numbers, find
Q40: Use the circle graph to solve
Q41: For the set of numbers, find
Q42: Use the circle graph to solve the
Q43: Find the median for the set
Q45: Given the grades of a student
Q46: The bar graph below shows the
Q47: Find any modes that exist.<br>- <span
Q48: Find the median for the set
Q49: Solve the problem.<br>-An experiment is done to