Multiple Choice
Refer to the double-bar graph below which shows the number of male and female athletes at a university over a four-year period. Solve the problem.
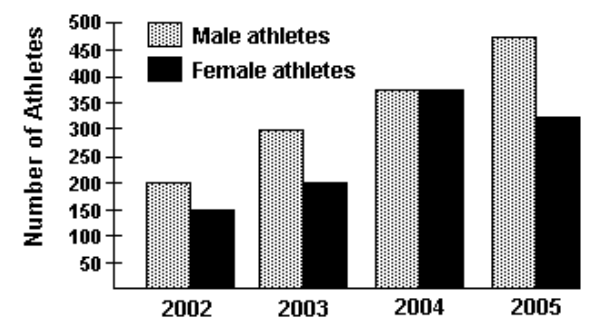
-Find the increase in the number of male athletes from 2004 to 2005.
A) 75
B) 475
C) 100
D) 50
Correct Answer:

Verified
Correct Answer:
Verified
Related Questions
Q57: Find the median for the set
Q58: Determine the quartiles as specified.<br>-The test scores
Q59: The histogram shows the scores of
Q60: Find any modes that exist.<br>- <span
Q61: Draw a tree diagram for the experiment.
Q63: Use the circle graph to solve the
Q64: For the set of numbers, find
Q65: Use the graph to answer the question.<br>
Q66: Obtain the five-number summary for the
Q67: Solve the problem.<br>-An experiment is done to