Multiple Choice
Refer to the double-bar graph below which shows the number of male and female athletes at a university over a four-year period. Solve the problem.
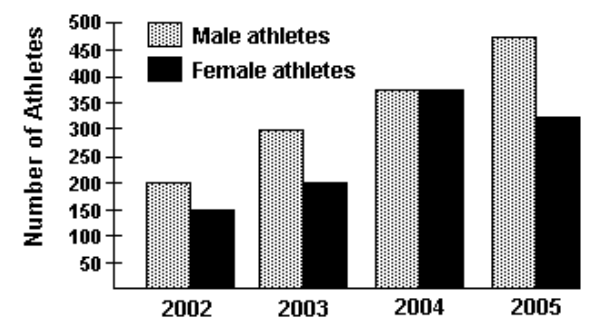
-Find the increase in the number of male athletes from 2002 to 2004.
A) 175
B) 150
C) 275
D) 125
Correct Answer:

Verified
Correct Answer:
Verified
Q50: Determine the quartiles as specified.<br>-The test scores
Q51: A deck of cards contains 52
Q52: A deck of cards contains 52
Q53: Construct the indicated stem-and-leaf.<br>-The following data show
Q54: Use the pictograph to answer the
Q56: Find the mean.<br>- <span class="ql-formula" data-value="9,9.2,7.4,9.2,7.2"><span
Q57: Find the median for the set
Q58: Determine the quartiles as specified.<br>-The test scores
Q59: The histogram shows the scores of
Q60: Find any modes that exist.<br>- <span