Multiple Choice
Use the graph to answer the question.
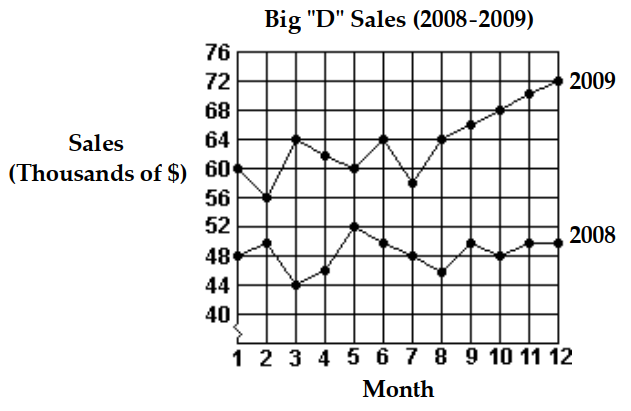
-What were the total sales for the first 6 months of 2008?
A)
B)
C)
D)
Correct Answer:

Verified
Correct Answer:
Verified
Related Questions
Q131: Find the median for the set
Q132: The following stem-and-leaf plot gives the
Q133: Use the pictograph to answer the question.<br>-This
Q134: The following table contains information about
Q135: Find the mean.<br>- <span class="ql-formula" data-value="39,47,27,43,24"><span
Q137: Solve the problem.<br>-Jackie's sisters weigh
Q138: A deck of cards contains 52
Q139: Refer to the double-bar graph below which
Q140: The bar graph below shows the
Q141: The bar graph below shows the number