Multiple Choice
Use the graph to answer the question.
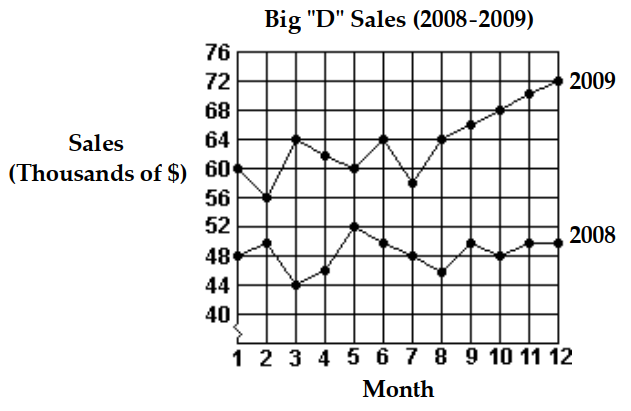
-What was the difference between the highest and lowest monthly sales in 2008?
A)
B)
C)
D)
Correct Answer:

Verified
Correct Answer:
Verified
Related Questions
Q68: Solve the problem.<br>-Use the frequency distribution table
Q69: A dart is thrown randomly and
Q70: The histogram shows the scores of each
Q71: The following table contains information about
Q72: Solve the problem.<br>-An experiment is done to
Q74: Twenty teenagers were asked to give their
Q75: Find the median for the set
Q76: Solve the problem.<br>-Jeremy's car got 240
Q77: A dart is thrown randomly and
Q78: Solve the problem.<br>-Draw a tree diagram for