Multiple Choice
Solve the problem.
-The following graph shows data for a recent train ride from New York to Toronto. Find the rate of change of the distance from New York with respect to time, in miles per hour. 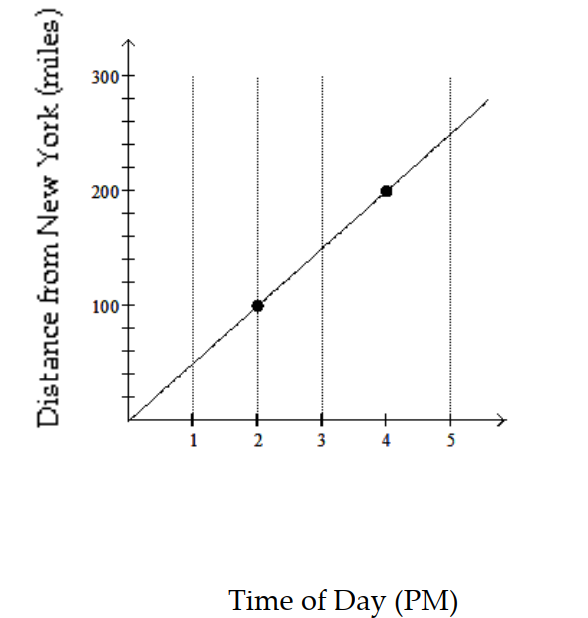
A) 50 miles per hour
B) 40 miles per hour
C) 100 miles per hour
D) 55 miles per hour
Correct Answer:

Verified
Correct Answer:
Verified
Q40: Find the slope of the line.<br>-
Q41: Graph the line containing the given
Q42: Write an equation for the graph.<br>-<img
Q43: Determine whether the graphs of the
Q44: Graph the linear equation.<br>- <span class="ql-formula"
Q46: Show that the two ordered pairs
Q47: Show that the two ordered pairs
Q48: Graph.<br>- <span class="ql-formula" data-value="x=-2"><span class="katex"><span class="katex-mathml"><math
Q49: Find the coordinates of the labeled
Q50: Find the slope of the line