Multiple Choice
Solve the problem.
-Data regarding the amount spent by a government department is represented in the following graph. Find the rate of change of the amount spent with respect to time, in billions per year.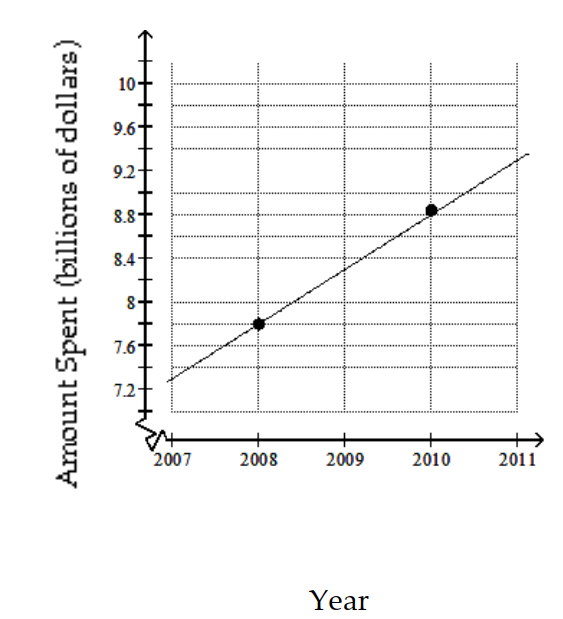
A) Increase of billion per year
B) Decrease of billion per year
C) Decrease of billion per year
D) Increase of billion per year
Correct Answer:

Verified
Correct Answer:
Verified
Q136: Find the slope of the line.<br>-<img
Q137: Find the coordinates of the
Q138: Determine whether the given ordered pair
Q139: Graph using the slope and the
Q140: Graph using the slope and the
Q142: Draw a line that has the
Q143: Find the coordinates of the
Q144: Find the slope of the line.<br>-<img src="https://d2lvgg3v3hfg70.cloudfront.net/TB9836/.jpg"
Q145: Find an equation of the line
Q146: Graph.<br>- <span class="ql-formula" data-value="-3 x=-5"><span class="katex"><span