Multiple Choice
The graph shows sales in thousands of dollars for 1989 and 1990. Use it to answer the question
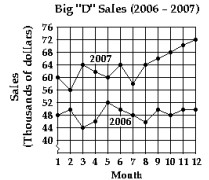
-If the ordered pair represents a point on the graph, what does represent? What does represent?
A) represents the month; represents the sales in thousands of dollars.
B) represents the month; represents the sales in thousands of dollars.
C) represents the year 2006; y represents the sales in thousands of dollars
D) represents the year 2006; y represents the year 2007 .
Correct Answer:

Verified
Correct Answer:
Verified
Q113: Decide whether the relation is a function.<br>-<img
Q114: How is the graph of a line
Q115: Find the slope.<br>- <span class="ql-formula" data-value="m=\frac{13-3}{7-5}"><span
Q116: Find the slope of the line
Q117: Solve the problem.<br>-The graphing calculator screen
Q119: An equation that defines <span
Q120: Solve the problem. Round your answer,
Q121: Decide whether the pair of lines
Q122: Find an equation of the line
Q123: Complete the table of ordered pairs