Multiple Choice
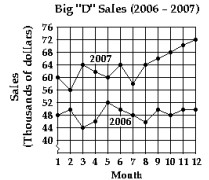
The graph shows sales in thousands of dollars for 1989 and 1990. Use it to answer the question

-Estimate the sales in June 2006.
A) about thousand
B) about thousand
C) about thousand
D) about thousand
Correct Answer:

Verified
Correct Answer:
Verified
Related Questions
Q103: The graph of the linear equation
Q104: Decide whether the pair of lines
Q105: Decide whether the relation is a
Q106: Find the slope of the line
Q107: Graph the line described.<br>-Through <span
Q109: Find the equation in slope-intercept form
Q110: Evaluate the function.<br>-The graph of
Q111: Graph the linear inequality in two
Q112: Graph the linear inequality in two
Q113: Decide whether the relation is a function.<br>-<img