Short Answer
The graph shows sales in thousands of dollars for 1989 and 1990. Use it to answer the question
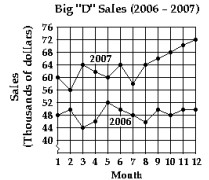
-What does the ordered pair for 2006 mean in the context of this graph?
Correct Answer:

Verified
In October 2006, the...View Answer
Unlock this answer now
Get Access to more Verified Answers free of charge
Correct Answer:
Verified
In October 2006, the...
View Answer
Unlock this answer now
Get Access to more Verified Answers free of charge
Related Questions
Q180: Graph the line described.<br>-Through <span
Q181: If the ordered pair <span
Q182: Plot the point on the rectangular
Q183: Plot the point on the rectangular
Q184: Find an equation of the line
Q186: Find an equation of the line,
Q187: Graph the equation by determining the
Q188: Graph the line described.<br>-Undefined slope; through
Q189: Graph the line described.<br>- <span class="ql-formula"
Q190: Decide whether the relation is a function.<br>-<img