Multiple Choice
The graph shows sales in thousands of dollars for 1989 and 1990. Use it to answer the question
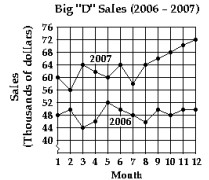
-Which month in 2007 had the highest sales?
A) Month 5
B) Month 12
C) Month 3
D) Month 6
Correct Answer:

Verified
Correct Answer:
Verified
Related Questions
Q307: Plot the point on the rectangular
Q308: The graph of the linear equation
Q309: Determine whether the relation defines
Q310: Find the slope of the line.<br>-<img src="https://d2lvgg3v3hfg70.cloudfront.net/TB10232/.jpg"
Q311: Graph the compound inequality.<br>- <span class="ql-formula"
Q313: Solve the problem<br>-For the incline shown
Q314: Graph the solution set of the
Q315: Decide whether the pair of lines
Q316: Find an equation of the line
Q317: Plot the point on the rectangular