Multiple Choice
The graph shows sales in thousands of dollars for 1989 and 1990. Use it to answer the question
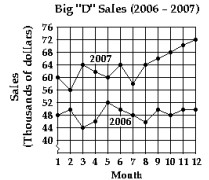
-What month in 2006 had the highest sales?
A) Month 2
B) Month 12
C) Month 3
D) Month 5
Correct Answer:

Verified
Correct Answer:
Verified
Related Questions
Q337: Graph the linear function. Give the
Q338: Complete the table for the equation.<br>-
Q339: Decide whether the pair of lines
Q340: Solve the problem.<br>-The graphing calculator screens
Q341: Solve the problem<br>-It costs <span
Q342: Find the slope of the line.<br>-<img src="https://d2lvgg3v3hfg70.cloudfront.net/TB10232/.jpg"
Q344: Decide whether the relation is a
Q345: Graph the linear inequality in two
Q346: Find the slope of the line
Q347: What is the difference between the