Multiple Choice
The graph shows sales in thousands of dollars for 1989 and 1990. Use it to answer the question
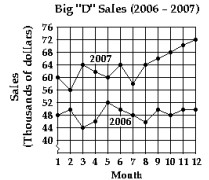
-What month in 2007 had the lowest sales?
A) Month 2
B) Month 5
C) Month 12
D) Month 3
Correct Answer:

Verified
Correct Answer:
Verified
Related Questions
Q68: Complete the table for the equation.<br>-
Q69: Find an equation of the line
Q70: Find an equation of the line
Q71: Find the slope.<br>- <span class="ql-formula" data-value="m=\frac{4-2}{9-4}"><span
Q72: Decide whether the pair of lines
Q74: Graph the compound inequality.<br>- <span class="ql-formula"
Q75: Graph the inequality or compound inequality.<br>-
Q76: Solve the problem.<br>-Suppose <span class="ql-formula"
Q77: Find the <span class="ql-formula" data-value="x"><span
Q78: An equation that defines <span