Multiple Choice
Find the average rate of change illustrated in the graph.
-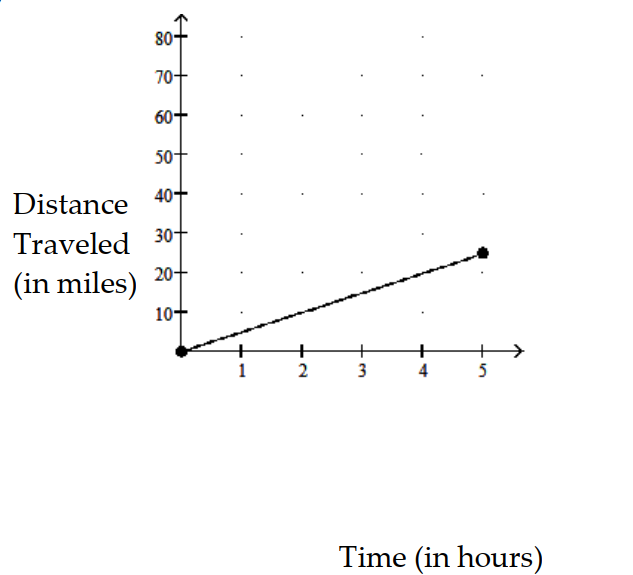
A) 2.5 miles per hour
B) .2 miles per hour
C) 5 miles per hour
D) 25 miles per hour
Correct Answer:

Verified
Correct Answer:
Verified
Related Questions
Q224: Graph the inequality or compound inequality.<br>-
Q225: Find the slope and the
Q226: The equation <span class="ql-formula" data-value="y=x^{2}"><span
Q227: Choose the graph that matches the
Q228: Graph the linear function. Give the
Q230: Solve the problem. Round your answer,
Q231: Graph the compound inequality.<br>- <span class="ql-formula"
Q232: Decide whether the relation is a
Q233: Solve the problem.<br>-Find <span class="ql-formula"
Q234: Graph the compound inequality.<br>- <span class="ql-formula"