Multiple Choice
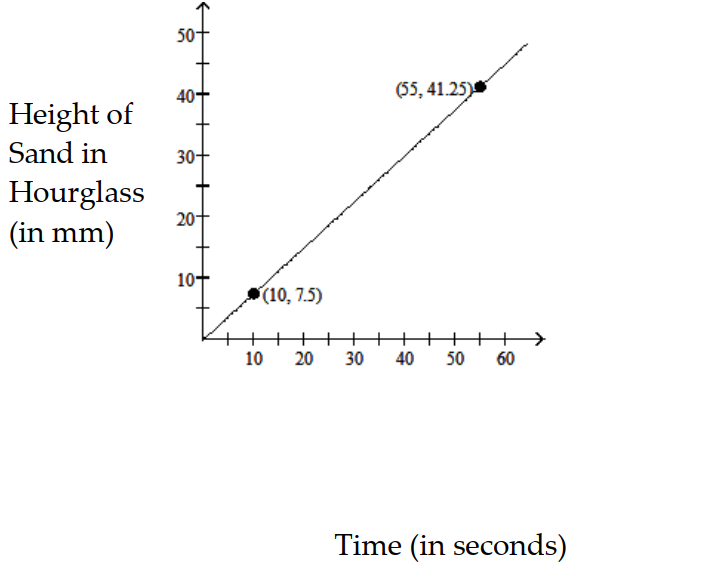
Find the average rate of change illustrated in the graph.
-
A) per second
B) per second
C) per second
D) per second
Correct Answer:

Verified
Correct Answer:
Verified
Related Questions
Q217: Solve the problem.<br>-Crafty Bill's Cool Car Sales
Q218: Find the equation in slope-intercept form
Q219: Decide whether the pair of lines
Q220: Decide whether the relation is a function.<br>-<img
Q221: Find an equation of the line
Q223: Choose the inequality that best matches
Q224: Graph the inequality or compound inequality.<br>-
Q225: Find the slope and the
Q226: The equation <span class="ql-formula" data-value="y=x^{2}"><span
Q227: Choose the graph that matches the