The Graph of the Linear Equation Is Shown on a Graphing Calculator Screen, Along with The on a Graphing
Multiple Choice
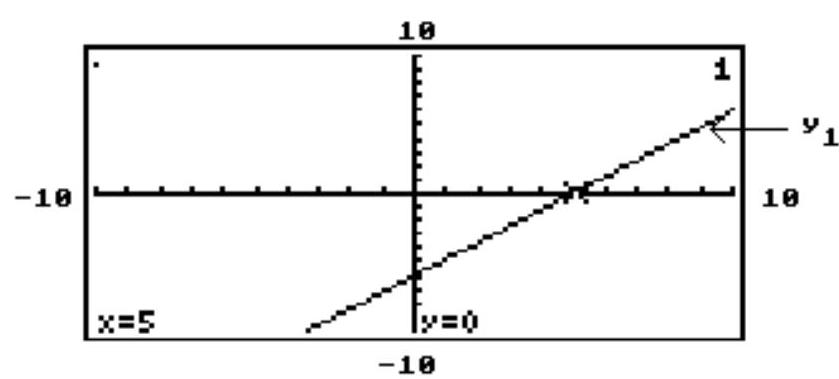
The graph of the linear equation is shown on a graphing calculator screen, along with the -value of the -intercept of the line. Use the screen to solve the following equation or inequality.
- 
A)
B)
C)
D)
Correct Answer:

Verified
Correct Answer:
Verified
Q192: Graph the solution set of the
Q193: Graph the linear inequality in two
Q194: Find the slope.<br>- <span class="ql-formula" data-value="m=\frac{2-4}{-3-1}"><span
Q195: Decide whether the relation is a function.<br>-<img
Q196: Graph the compound inequality.<br>- <span class="ql-formula"
Q198: Find the slope.<br>- <span class="ql-formula" data-value="\mathrm{m}=\frac{6-(-3)}{1-(-3)}"><span
Q199: Find an equation of the line
Q200: Graph the linear function. Give the
Q201: Solve the problem.<br>-Find <span class="ql-formula"
Q202: Graph the line described.<br>-Through <span