The Graph of the Linear Equation Is Shown on a Graphing Calculator Screen, Along with The on a Graphing
Multiple Choice
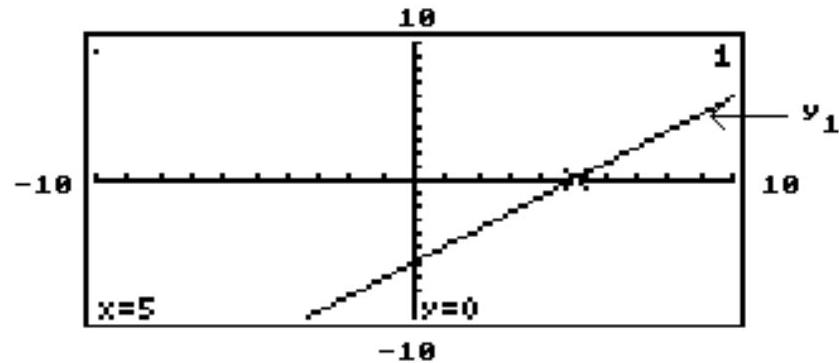
The graph of the linear equation is shown on a graphing calculator screen, along with the -value of the -intercept of the line. Use the screen to solve the following equation or inequality.
- 
A)
B)
C)
D)
Correct Answer:

Verified
Correct Answer:
Verified
Q186: Find an equation of the line,
Q187: Graph the equation by determining the
Q188: Graph the line described.<br>-Undefined slope; through
Q189: Graph the line described.<br>- <span class="ql-formula"
Q190: Decide whether the relation is a function.<br>-<img
Q192: Graph the solution set of the
Q193: Graph the linear inequality in two
Q194: Find the slope.<br>- <span class="ql-formula" data-value="m=\frac{2-4}{-3-1}"><span
Q195: Decide whether the relation is a function.<br>-<img
Q196: Graph the compound inequality.<br>- <span class="ql-formula"