Multiple Choice
Solve the problem.
-The information in the chart gives the salary of a person for the stated years. Use the information for the years 2001 and 2003 to find an equation that models the data. Let represent 2001, represent 2003, and y represent the salary. Write the equation in slope-intercept form. Use this equation to approximate the salary for 2004 to the nearest dollar.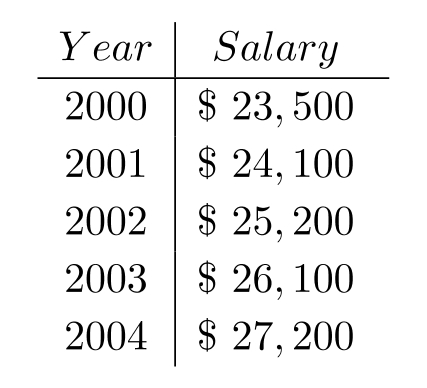
A)
B)
C)
D)
Correct Answer:

Verified
Correct Answer:
Verified
Q163: Solve the problem.<br>-The table of ordered
Q164: To graph a straight line, we must
Q165: Find the slope.<br>- <span class="ql-formula" data-value="\mathrm{m}=\frac{-10-(-10)}{7-4}"><span
Q166: Choose the inequality that best matches
Q167: Evaluate the function.<br>-Find <span class="ql-formula"
Q169: Find the <span class="ql-formula" data-value="x"><span
Q170: Complete the table for the equation.<br>-
Q171: Graph the line described.<br>-Through <span
Q172: Plot the point on the rectangular
Q173: Solve the problem<br>-Let <span class="ql-formula"