Multiple Choice
The graphs below represent the supply and demand for a product at various prices per unit. At approximately what price does supply equal demand?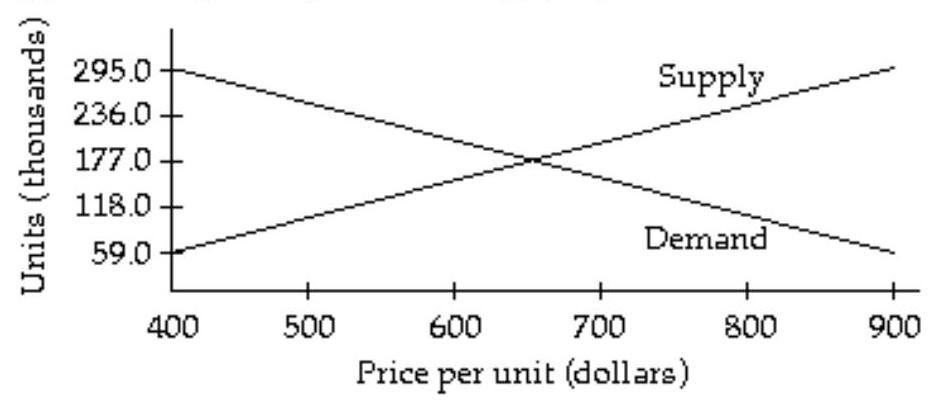
A)
B)
C)
D)
Correct Answer:

Verified
Correct Answer:
Verified
Q125: Solve the system of equations. If
Q126: How many liters (L) of a
Q127: Without solving the following system of
Q128: Write the word or phrase that
Q129: Tell how many solutions the system
Q131: Solve the system by substitution or
Q132: Solve the system by substitution. If
Q133: <span class="ql-formula" data-value="x-y+5 z=4"><span class="katex"><span class="katex-mathml"><math xmlns="http://www.w3.org/1998/Math/MathML"><semantics><mrow><mi>x</mi><mo>−</mo><mi>y</mi><mo>+</mo><mn>5</mn><mi>z</mi><mo>=</mo><mn>4</mn></mrow><annotation
Q134: <span class="ql-formula" data-value="3 x+3 y+z=1"><span class="katex"><span class="katex-mathml"><math
Q135: Solve the system by substitution. If