Multiple Choice
The hyperbola shown in the calculator-generated graph was graphed in function mode with a square viewing window. What are the two functions and that were used to obtain the graph whose equation is given?
- 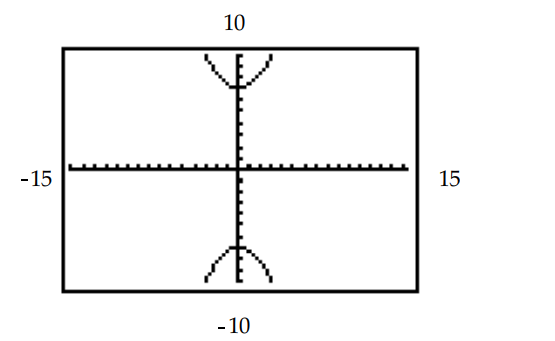
A)
B)
C)
D)
Correct Answer:

Verified
Correct Answer:
Verified
Q33: The circle or ellipse shown in
Q34: Graph the circle.<br>- <span class="ql-formula" data-value="(x-6)^{2}+(y-2)^{2}=16"><span
Q35: Graph the system of inequalities.<br>- <span
Q36: Describe the graph of the solution
Q37: Solve the system by the substitution
Q39: Solve the problem. Round your answer
Q40: What is the only real number
Q41: The <span class="ql-formula" data-value="y"><span class="katex"><span
Q42: Suppose that a nonlinear system is composed
Q43: Graph the rational function.<br>-f(x) =