Multiple Choice
The graphs show the sales of two companies competing for market share.
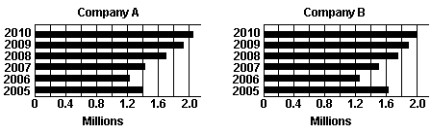
-During which years were the sales of Company B less than those of Company A?
A) None
B)
C) 2010
D) 2009,2010
Correct Answer:

Verified
Correct Answer:
Verified
Q60: Multiply or divide as indicated. Make
Q61: Write the mixed number as an
Q62: After one round in a card game,
Q63: Use an example to explain the difference
Q64: Use inequality symbols to rewrite the
Q66: Add or subtract as indicated. Make
Q67: Evaluate the expression.<br>- <span class="ql-formula" data-value="\left(-\frac{1}{2}\right)^{6}"><span
Q68: <span class="ql-formula" data-value="(-7)^{9}"><span class="katex"><span class="katex-mathml"><math xmlns="http://www.w3.org/1998/Math/MathML"><semantics><mrow><mo stretchy="false">(</mo><mo>−</mo><mn>7</mn><msup><mo
Q69: Write the set using interval notation.<br>-
Q70: Graph the elements of the set