Multiple Choice
The graphs show the sales of two companies competing for market share.
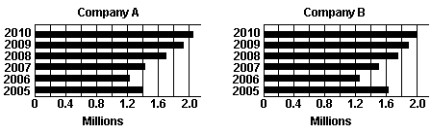
-During which years were the sales of Company B greater than or equal to 1.8 million items?
A) 2005, 2006, 2007
B) 2005, 2006, 2007, 2008
C)
D) 2009,2010
Correct Answer:

Verified
Correct Answer:
Verified
Related Questions
Q199: Perform the indicated operation.<br>- <span class="ql-formula"
Q200: Subtract as indicated. Write the answer
Q201: Write the set by listing its
Q202: Give the additive inverse of the
Q203: Find the square root. If it
Q205: Use the order of operations to
Q206: Perform the indicated operations.<br>- <span class="ql-formula"
Q207: A student claims that <span
Q208: Explain why the statement <span
Q209: Use the order of operations to