Multiple Choice
The graphs show the sales of two companies competing for market share.
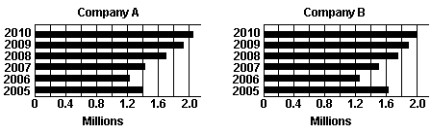
-If represents Company B's sales in 2005 and y represents Company B's sales in 2008, the relationship between and is
A)
B)
C)
Correct Answer:

Verified
Correct Answer:
Verified
Related Questions
Q134: Write as a percent.<br>-0.00313<br>A) <span
Q135: Find the value of the expression.<br>-
Q136: Find the value of the expression.<br>-
Q137: List the elements from A that
Q138: The two charts show the weight gain
Q140: Decide whether the statement is .<br>-The difference
Q141: Add or subtract as indicated.<br>- <span
Q142: Use inequality symbols to rewrite the
Q143: Rewrite the statement so the inequality
Q144: Simplify the expression.<br>- <span class="ql-formula" data-value="-3(2