Multiple Choice
The graphs show the sales of two companies competing for market share.
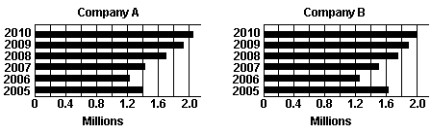
-During which years were the sales of Company B greater than those of Company A?
A) 2005,2006
B)
C) 2009,2010
D) None
Correct Answer:

Verified
Correct Answer:
Verified
Related Questions
Q370: Find the distance between the given
Q371: The ocean surface is at
Q372: Write the fraction in lowest terms.<br>-
Q373: Find the value of the expression.<br>-
Q374: Perform the indicated operation.<br>- <span class="ql-formula"
Q376: Find the appropriate property for the
Q377: Write the set by listing its
Q378: Multiply as indicated. Write the answer
Q379: Add or subtract as indicated.<br>- <span
Q380: The NSC (Not So Consistent) Corporation