Multiple Choice
The graphs show the sales of two companies competing for market share.
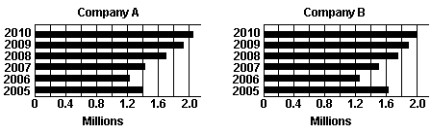
-If represents Company B's sales in 2007 and represents Company A's sales in the same year, then the relationship between and is
A)
B)
C)
Correct Answer:

Verified
Correct Answer:
Verified
Q83: Multiply as indicated. Write the answer
Q84: Add as indicated. Write the answer
Q85: Determine whether the inequality is <br>-
Q86: Write the expression by using exponents.<br>-
Q87: Perform the indicated operation.<br>- <span class="ql-formula"
Q89: Add or subtract as indicated. Make
Q90: For the expression <span class="ql-formula"
Q91: Change the fraction to a decimal.
Q92: Perform the indicated operation.<br>- <span class="ql-formula"
Q93: Write as a decimal.<br>- <span class="ql-formula"