Short Answer
The following graph shows one of a firm's isocost curves and isoquants.
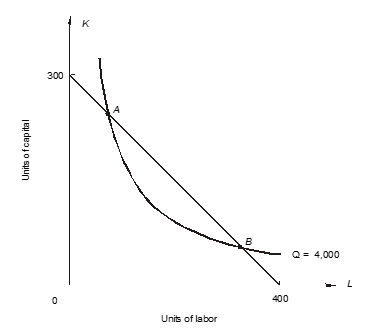
-Combination A is not an economically efficient method of producing 4,000 units of output because, at A, _________ exceeds _________ or, in other words, _________ exceeds _________. The firm should increase ___________ and decrease ___________.
Correct Answer:

Verified
MRTS; the input pric...View Answer
Unlock this answer now
Get Access to more Verified Answers free of charge
Correct Answer:
Verified
View Answer
Unlock this answer now
Get Access to more Verified Answers free of charge
Q34: Using the above table, answer the following
Q35: refer to the following:<br> <img src="https://d2lvgg3v3hfg70.cloudfront.net/TB10434/.jpg" alt="refer
Q36: The following graph shows 2 isocost curves
Q37: Use the following figure that shows a
Q38: refer to the following:<br> <img src="https://d2lvgg3v3hfg70.cloudfront.net/TB10434/.jpg" alt="refer
Q40: Answer the following questions concerning an expansion
Q41: A firm increases its usage of all
Q42: The following graph shows one of a
Q43: Suppose that when a firm increases its
Q44: A firm is producing 1,000 units of