Multiple Choice
Use the figure to calculate the income elasticity of demand when income increases from $25,000 to $30,000: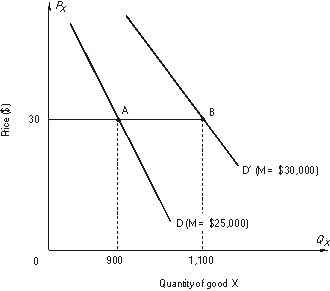
A) -0.10
B) -1.10
C) 0.1818
D) 0.20
E) 1.10
Correct Answer:

Verified
Correct Answer:
Verified
Related Questions
Q1: Use the graph below to answer the
Q2: refer to the following figure:<br> <img src="https://d2lvgg3v3hfg70.cloudfront.net/TB10434/.jpg"
Q3: Fill in the blanks.<br>-When a change in
Q5: Use the linear demand curve shown below
Q6: Suppose the demand for good X is<br><img
Q7: refer to the following table showing a
Q8: Use the linear demand curve shown below
Q9: refer to the following figure:<br> <img src="https://d2lvgg3v3hfg70.cloudfront.net/TB10434/.jpg"
Q10: Fill in the blanks.<br>-If price rises and
Q11: Boeing estimates the elasticity of demand for