Short Answer
In the graph shown below, the demand for good X shifts due to a change in income. Holding the price of good X constant at $200, answer the following questions:
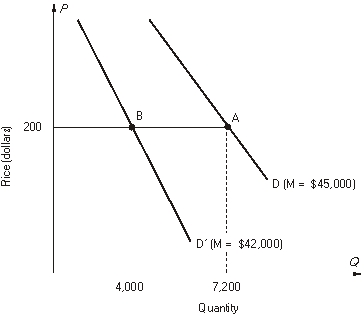
-The graph shows how the demand
for X shifts when income decreases from $45,000 to $42,000. Using the information in the graph, the income elasticity of demand for X is calculated to be _________.
Correct Answer:

Verified
Correct Answer:
Verified
Q35: Use the figure below to answer the
Q36: Fill in the blanks.<br>-If price falls and
Q37: Fill in the blanks.<br>-When demand is elastic,
Q38: Use the figure below to calculate the
Q39: Use the graph below to answer the
Q41: Fill in the blanks.<br>-When demand is inelastic,
Q42: Use the linear demand curve shown below
Q43: Fill in the blanks in the figure
Q44: refer to the following figure:<br> <img src="https://d2lvgg3v3hfg70.cloudfront.net/TB10434/.jpg"
Q45: Use the figure to calculate the income