Short Answer
In the graph shown below, the demand for good X shifts due to a change in the price of a related good Y. Holding the price of good X constant at $200, answer the following questions:
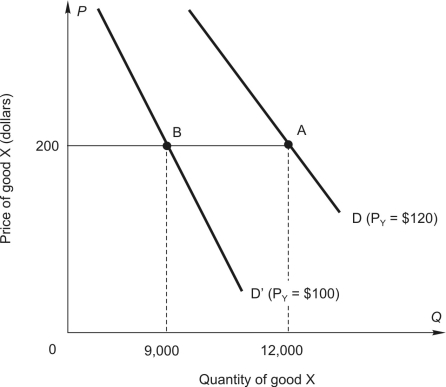
-Goods X and Y are ________________.
Correct Answer:

Verified
Correct Answer:
Verified
Related Questions
Q24: The price elasticity of demand for a
Q25: Boeing estimates the elasticity of demand for
Q26: If the price elasticity of DVD recorders
Q27: Use the graph below to answer the
Q28: Use the figure below to answer the
Q30: Fill in the blanks.<br>-When demand is elastic,
Q31: In the graph shown below, the demand
Q32: Use the graph below to answer the
Q33: Use the linear demand curve shown below
Q34: Fill in the blanks.<br>-If price rises and