Multiple Choice
refer to the following figure that shows the effect of an INCREASE in the price of X.
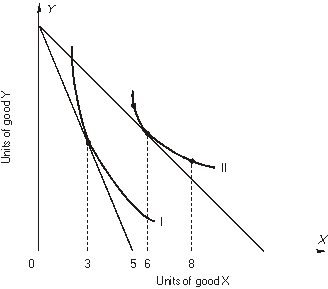
-The total effect of the price change is the change in the consumption of X from
A) 5 to 3.
B) 6 to 3.
C) 6 to 5.
D) 6 to 8.
E) none of the above
Correct Answer:

Verified
Correct Answer:
Verified
Q24: If the price of a good decreases,
Q25: refer to the following:<br> <img src="https://d2lvgg3v3hfg70.cloudfront.net/TB10434/.jpg" alt="refer
Q26: refer to the following figure:<br> <img
Q27: Use the following graph showing a consumer's
Q28: refer to the following figure:<br> <img
Q30: refer to the following figure:<br> <img src="https://d2lvgg3v3hfg70.cloudfront.net/TB10434/.jpg"
Q31: The following figure shows a portion of
Q32: refer to the following figure:<br> <img src="https://d2lvgg3v3hfg70.cloudfront.net/TB10434/.jpg"
Q33: The marginal rate of substitution of X
Q34: If a demand curve slopes upward, then<br>A)