Short Answer
Use the following graph showing two budget lines, LR and LZ to answer the following questions. The consumer's income is $720.
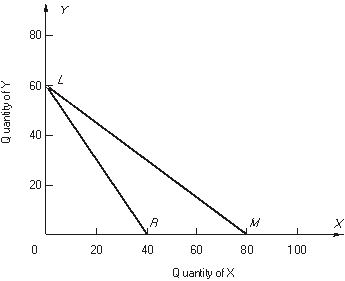
-For budget line LR the price of Y is $______ and the price of X is $______. The equation for budget line LR is ________________________.
Correct Answer:

Verified
Correct Answer:
Verified
Q1: If the price of good X rises
Q3: F A. The rate at which a
Q4: refer to the following figure:<br> <img
Q5: Fill-in-the-Blank<br>-The rate at which a consumer is
Q6: The following questions refer to the following
Q7: refer to the following graphs:<br> <br> <img
Q8: If the price of a good decreases,
Q9: The following questions refer to the following
Q10: refer to the following graph:<br><img src="https://d2lvgg3v3hfg70.cloudfront.net/TB10434/.jpg" alt="refer
Q11: Fill-in-the-Blank<br>-If a consumer is choosing the levels