Short Answer
The following figure shows a portion of a consumer's indifference map and budget lines. The price of good Y is $7 and the consumer's income is $700.
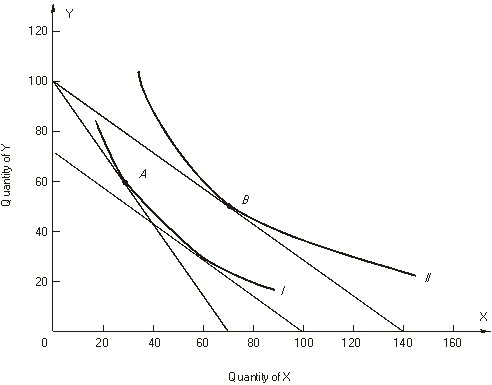 Let the consumer begin in utility maximizing equilibrium at point A on indifference curve I. Next the price of good X changes so that the consumer moves to a new utility maximizing equilibrium at point B on indifference curve II.
-Two points on this consumer's demand for good X are PX = $______ and X = ______; and PX = $______ and X = ______.
Correct Answer:

Verified
Correct Answer:
Verified
Q9: The following questions refer to the following
Q10: refer to the following graph:<br><img src="https://d2lvgg3v3hfg70.cloudfront.net/TB10434/.jpg" alt="refer
Q11: Fill-in-the-Blank<br>-If a consumer is choosing the levels
Q12: The Giffen Paradox results whenever<br>A) the substitution
Q13: An individual's demand curve for X<br>A) shows
Q15: A. Demand curves slope downward because the
Q16: refer to the following figure that shows
Q17: The marginal rate of substitution of X
Q18: refer to the following figure that shows
Q19: The following figure shows a portion of