Short Answer
Use the following graph showing the marginal benefit and marginal cost curves for activity A to answer the following questions.
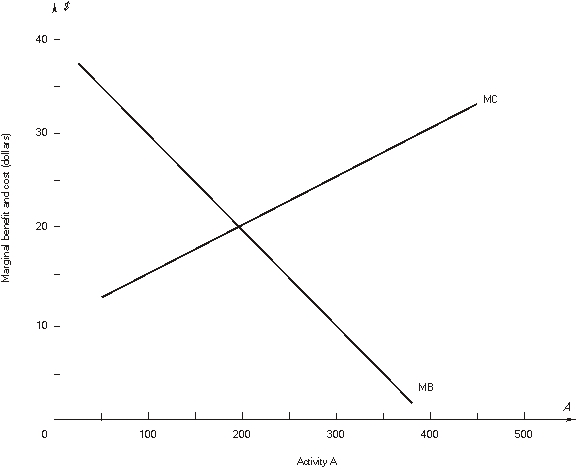
-If 100 units of A are chosen, net benefit will increase by $_________ if one _________ unit of A is chosen.
Correct Answer:

Verified
Correct Answer:
Verified
Related Questions
Q1: Fill in the blanks in the following
Q2: Use the following graph showing the marginal
Q3: refer to the following:<br>A manager in charge
Q5: refer to the following:<br>The manager of the
Q6: Fill in the blanks in the following
Q7: Activity A has the following marginal (MB)
Q8: The marginal benefit and marginal cost functions
Q9: Fill in the blanks in the following
Q10: Use the following graph showing the marginal
Q11: The next questions refer to the