Essay
Use the data below to answer the following questions:
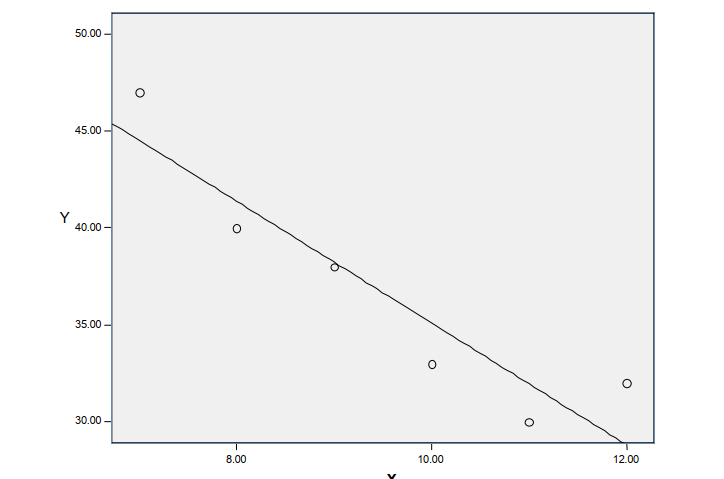
a. Create a scatterplot using the data below.
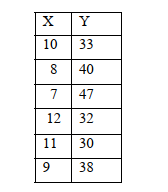 b. Calculate the slope and the y-intercept for the regression line for the distribution. Write the regression line equation.
Slope:
Y-intercept:
Regression line:
 c.Interpret the numbers of boththe slope and the y-intercept.
d.Compute r and 2 for the regression equation.
e. Interpret both the r and 2 What does each number tell us?
Correct Answer:

Verified
a.  b.Slope: -3.14
Y-intercept: 66.52
Re...View Answer
Unlock this answer now
Get Access to more Verified Answers free of charge
Correct Answer:
Verified
Y-intercept: 66.52
Re...
View Answer
Unlock this answer now
Get Access to more Verified Answers free of charge
Q18: If r<sup>2</sup> =.40, what percent of the
Q19: Use the data below to answer questions:<br>
Q20: r<sup>2</sup> represents the percent of total variance
Q21: In the linear regression equation, Y=a+bx, "a"
Q22: A relationship is said to be strong
Q23: Based on the equation in question 4,
Q24: In the linear regression equation, "b" represents
Q25: Use the table below to answer the
Q27: Based on the equation in question 1,
Q28: Use the data below to answer questions:<br>