Multiple Choice
The figure below shows the hypsometric curve for Earth.Which of the following can be concluded from the plot of this data? 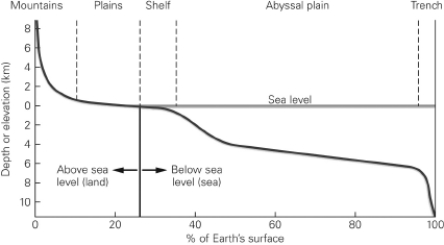
A) Regions of high elevation (> 4 km) are common on Earth.
B) Most of the continents are between 0 and 1 km above sea level.
C) Elevations of -10 km to 8 km are nearly uniformly distributed across Earth's surface.
D) Most of the sea floor is more than 6 km below sea level.
Correct Answer:

Verified
Correct Answer:
Verified
Q1: The distinction between the crust and the
Q38: Which of the following statements about Earth's
Q39: The densest layer of Earth is the
Q40: As compared to the rocks that make
Q41: The thickness of Earth's crust varies from
Q44: The image below shows an example of
Q45: During a journey to the center of
Q46: In general,seismic (earthquake-generated)waves travel _ in the
Q47: The density of rocks is generally related
Q58: Most of the ocean floor is made