Multiple Choice
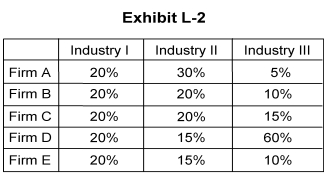
-In Exhibit L-2, the table shows the market shares of five firms that operate in three different industries. The highest concentration ratio appears in
A) Industry I
B) Industry II
C) Industry III
D) Industries I and III (their concentration ratios are identical)
E) Industries II and III (their concentration ratios are identical)
Correct Answer:

Verified
Correct Answer:
Verified
Q177: A "sticky price" model has its primary
Q178: In order to practice price discrimination, the
Q179: In agriculture, where firms producing similar goods
Q180: Under what circumstances do firms in a
Q181: Data concerning the four-firm concentration ratios for
Q183: If the four-firm concentration ratio for an
Q184: In a Nash equilibrium outcome for a
Q185: <img src="https://d2lvgg3v3hfg70.cloudfront.net/TB10702/.jpg" alt=" -In Exhibit L-2,
Q186: The concentration ratio of a monopoly industry
Q187: Suppose Ford, GM, and Chrysler produce all