Multiple Choice
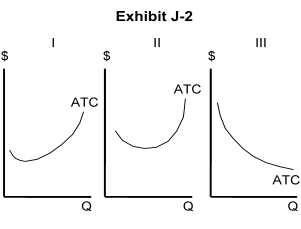
-In Exhibit J-2, which of the following graphs of a firm's ATC best represent(s) a natural monopoly?
A) I
B) II
C) III
D) I and II
E) I and III
Correct Answer:

Verified
Correct Answer:
Verified
Related Questions
Q163: Advertising is used by firms to increase
Q164: <img src="https://d2lvgg3v3hfg70.cloudfront.net/TB10702/.jpg" alt=" -In Exhibit J-3,
Q165: Your textbook uses steel, concrete, and aluminum
Q166: When a producer's demand curve is a
Q167: The spectrum of market structures, aligned from
Q169: Think of the firms and industries that
Q170: When the charge against ALCOA for exercising
Q171: Think about cost structures associated with each
Q172: Oligopoly and monopolistic competition can be described
Q173: If all the firms producing a good