Multiple Choice
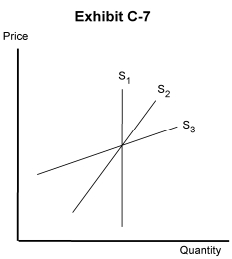
-In Exhibit C-7, the curve labeled S2 represent a
A) short-run supply curve
B) demand-related supply curve
C) long-run supply curve
D) quantity-related supply curve
E) market-day supply curve
Correct Answer:

Verified
Correct Answer:
Verified
Q81: <img src="https://d2lvgg3v3hfg70.cloudfront.net/TB10702/.jpg" alt=" -In Exhibit C-10,
Q82: When the market generates an equilibrium price,
Q83: <img src="https://d2lvgg3v3hfg70.cloudfront.net/TB10702/.jpg" alt=" -In Exhibit C-5,
Q84: Which of the following would cause a
Q85: An increase in market supply will increase
Q87: In the long run,<br>A) output, once determined,
Q88: <img src="https://d2lvgg3v3hfg70.cloudfront.net/TB10702/.jpg" alt=" -Which of the
Q89: The market demand for a good is
Q90: Excess demand or excess supply will always
Q91: If the price of a good is