Multiple Choice
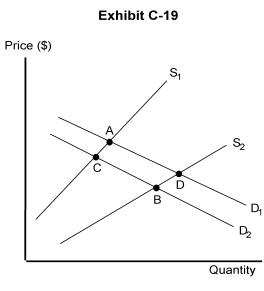
-In Exhibit C-19, the shift of the demand curve is best explained by a change in
A) the quantity demanded
B) resources prices
C) prices
D) the prices of other goods
E) the number of demanders and suppliers
Correct Answer:

Verified
Correct Answer:
Verified
Related Questions
Q63: Over the past couple of years, prices
Q64: Suppose there is an increase in the
Q65: The equilibrium quantity of Smids would be
Q66: Population growth will most likely lead to
Q67: If the price of Chinese food decreases,
Q69: Which of the following is not a
Q70: Suppose there are 100 people with identical
Q71: A market demand curve is<br>A) the sum
Q72: For complementary goods, an increase in the
Q73: A decrease in supply means that<br>A) demand