Multiple Choice
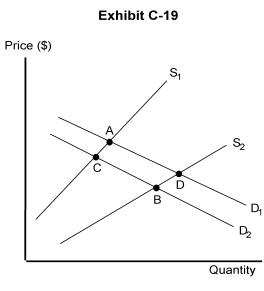
-In Exhibit C-19, a movement from A to B is best explained by
A) an increase in income and in the number of suppliers
B) an increase in the price of other goods
C) an increase in the population
D) a decrease in income and an improvement in the technology used to produce the good
E) equilibrium quantity increases and the equilibrium price change is indeterminate
Correct Answer:

Verified
Correct Answer:
Verified
Q40: The time interval in which suppliers can
Q41: The short run is depicted by a
Q42: A long-run supply curve is more price
Q43: Which of the following can bring about
Q44: Price doesn't change in a market-day supply
Q46: If people buy less of a good
Q47: The quantity supplied of a good for
Q48: Consider a market that is initially in
Q49: The horizontal summing of individual demand curves
Q50: Which of the following is true about