Multiple Choice
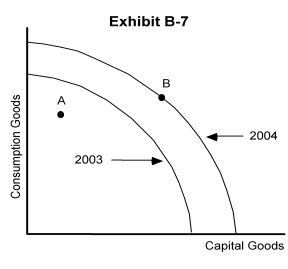
-Exhibit B-7 shows the production possibilities curves for a country for the years 2003 and 2004. Which of the following could have caused this shift in the production possibility curves?
A) a decrease in unemployment
B) a decline in technology
C) an increase in the quantity of capital goods used as a resource
D) a natural disaster
E) more efficient production
Correct Answer:

Verified
Correct Answer:
Verified
Q86: The Irish production possibilities curve shifts to
Q87: Opportunity cost is measured by the<br>A) dollars
Q88: Exhibit B-1 below shows the quantity of
Q89: <img src="https://d2lvgg3v3hfg70.cloudfront.net/TB10702/.jpg" alt=" -In Exhibit B-17,
Q90: The United States has an absolute advantage
Q92: Labor resources include<br>A) only physical exertion<br>B) only
Q93: An economy's production possibilities curve depicts different
Q94: Specialization refers to<br>A) one person performing a
Q95: The work of a firm's manager is<br>A)
Q96: a. Give an economics-based explanation for why