Multiple Choice
Use the following information for questions:
On a survey conducted at a university, students were asked how they felt about their weight (about right, overweight, or underweight) , and also were asked to record their grade point average (GPA) . There were 234 responses, with 160 saying their weight was about right, 50 said they were overweight, and 17 underweight. The question of interest is whether mean GPA is the same or differs for different weight attitude populations. Minitab output for the study is given below.
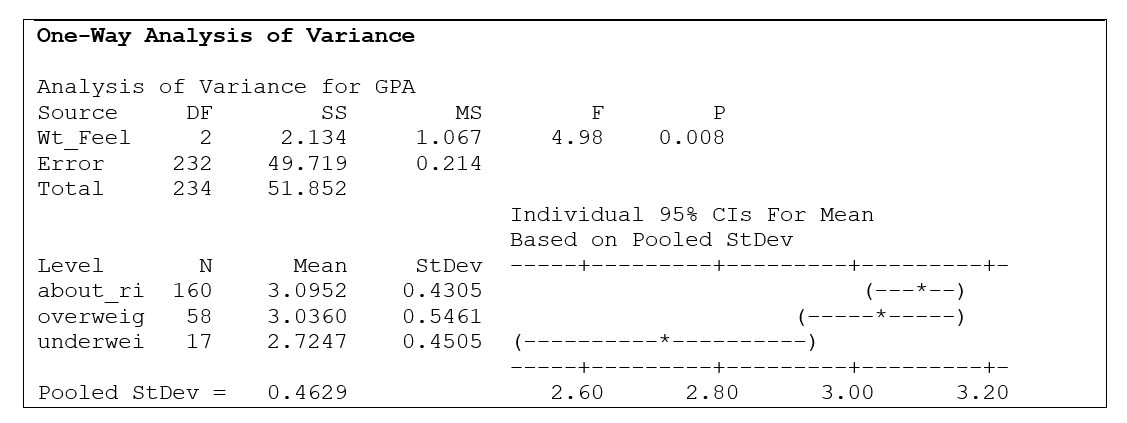
-Assuming the population standard deviations are equal, the best estimate of the standard deviation of GPAs for the populations represented is:
A) 0.4305
B) 0.5461
C) 0.4505
D) 0.4629
Correct Answer:

Verified
Correct Answer:
Verified
Q15: Use the following information for questions:<br> A
Q16: For a survey of 900 college students,
Q17: Use the following information for questions:<br>On
Q18: A two-way analysis of variance is used
Q19: Use the following information for questions:<br>Using data
Q21: Use the following information for questions:<br>
Q22: Use the following information for questions:<br> A
Q23: Use the following information for questions:<br>Using data
Q24: Which one of the following choices describes
Q25: Use the following information for questions:<br>Eighty-one customers